Chart
Bhutan's Public Pay Bill, 2018-19 to 2024-25
Download SVG Download data (CSV) Free to republish with credit to bht99.com · CC BY 4.0
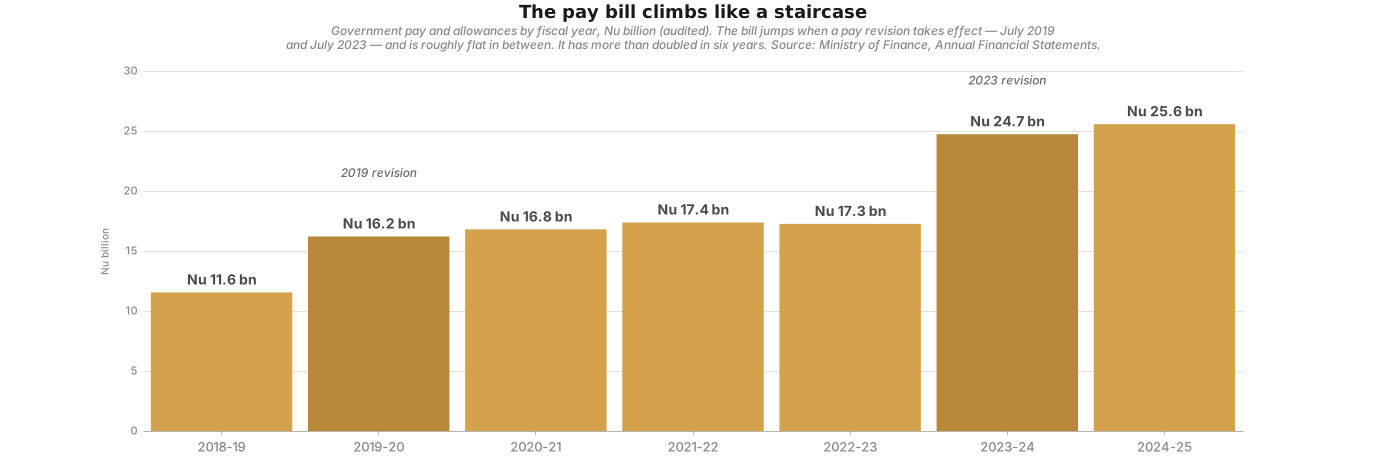
The bars show what the government spent on pay and allowances each fiscal year (July to June), from the Ministry of Finance’s audited accounts.
The shape is a staircase with two steps. The bill rose by about 40% in 2019-20, when the 2019 revision took effect, then stayed between Nu 16 and 17.5 billion for four years. It rose again by 43% in 2023-24, when the 2023 revision took effect, and reached Nu 25.6 billion in 2024-25: more than twice the 2018-19 figure.
In 2024-25 the bill was about 56% of the government’s current spending and 41% of its domestic revenue. As a share of GDP it was 8.9%, about where it stood in 2019-20, because the economy grew over the same years.
The figures are pay and allowances plus other personnel emoluments. They leave out provident fund contributions and retirement benefits, which add about Nu 2.3 billion a year.
Read with: The Bill: What Public Pay Costs Bhutan and what each revision added.
The data
| Fiscal year | Pay and allowances (Nu billion) |
|---|---|
| 2018-19 | 11.55 |
| 2019-20 | 16.21 |
| 2020-21 | 16.8 |
| 2021-22 | 17.37 |
| 2022-23 | 17.26 |
| 2023-24 | 24.73 |
| 2024-25 | 25.57 |
Free to republish with credit to bht99.com (CC BY 4.0). Download as CSV.